CHART PATTERN
Chart pattern have a defined formation and expectation of the potential future price behaviour.
The following below are some of chart pattern we going to discuss
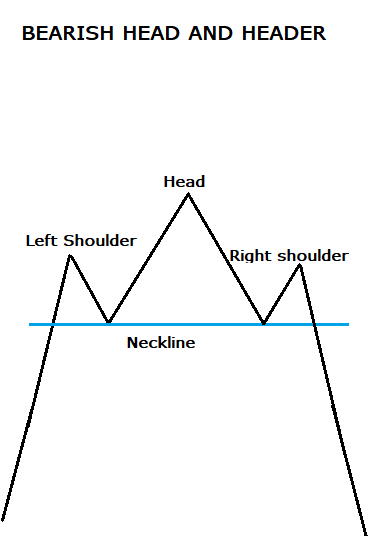
It is a trend reversal formation.
It's called head and shoulders because this is kind of what looks like.
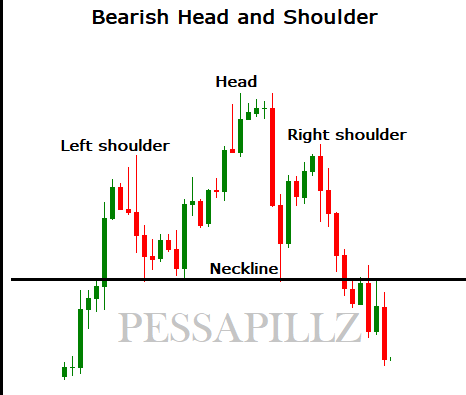
Bearish Head and Shoulders
This is the signal that bullish trend it's over the market now reverse from bullish to bearish trend.
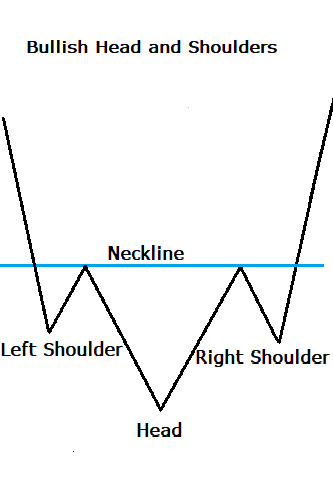
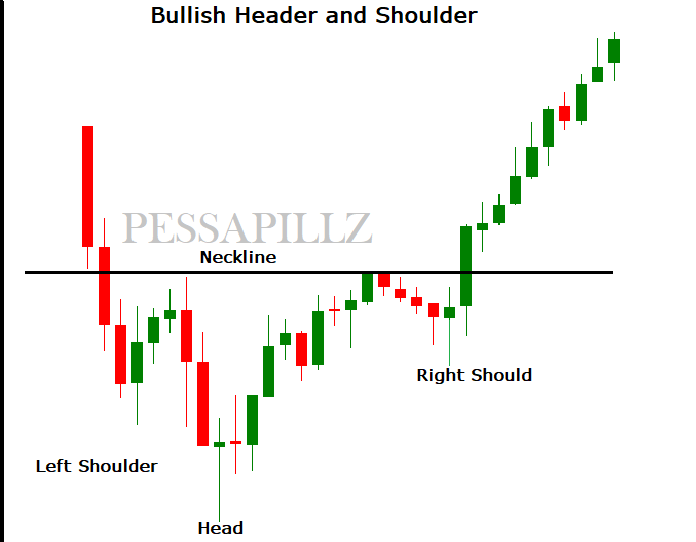
 Bullish Head and Shoulders (Inverted Head and Shoulder)
This is the signal that bearish trend is reached at the end now the market is reverse to bullish
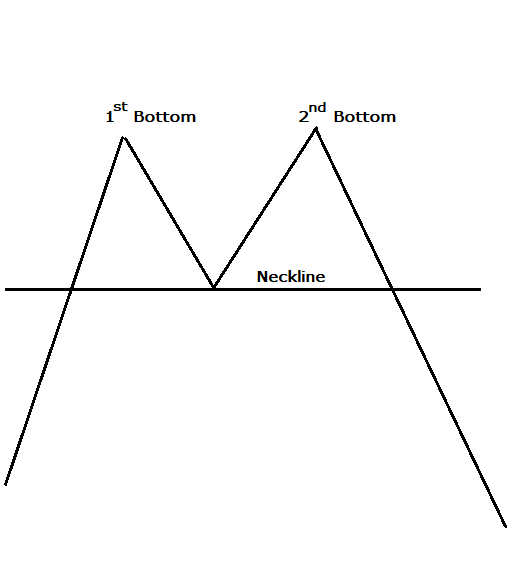
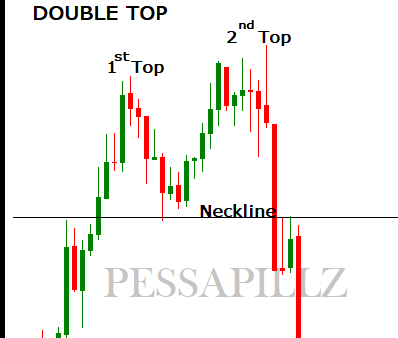
 Double Top
A double top is a bearish reversal chart pattern.
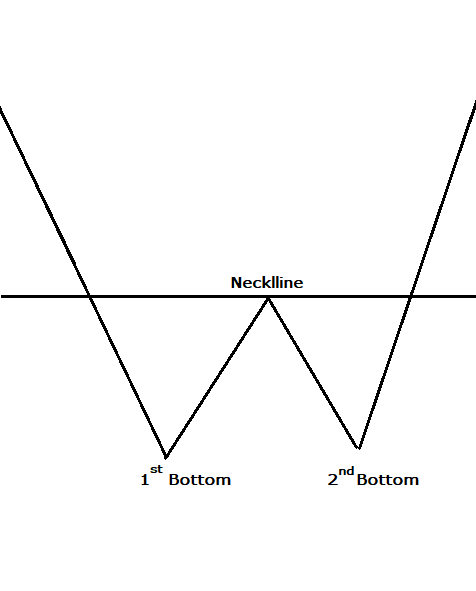
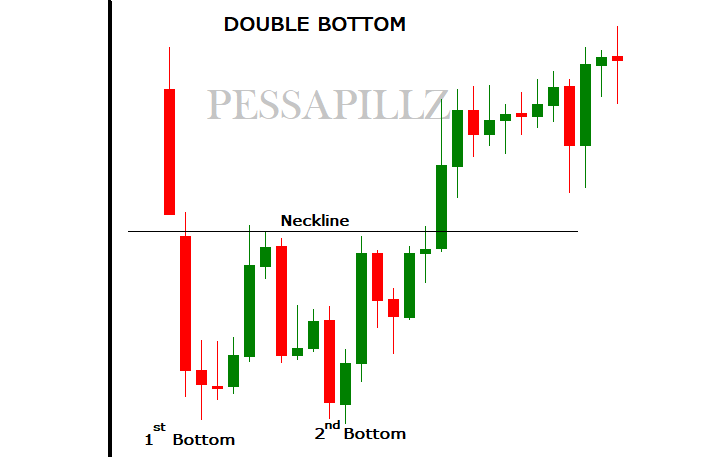
 Double Bottom
A double botton is a bullish reversal chart pattern.
 Triple Top
A bearish reversal pattern.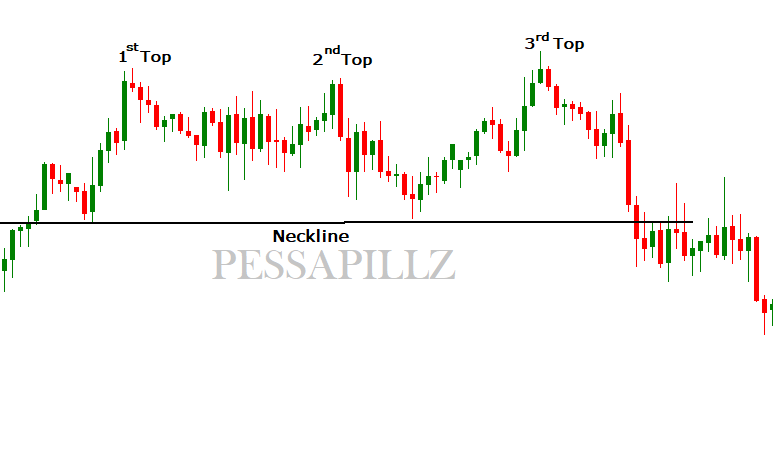 Triple Bottom
A triple bottom is a bullish reversal chart pattern.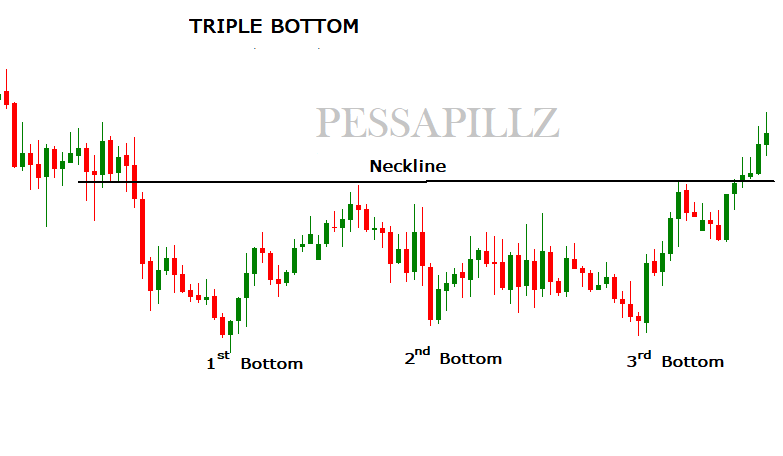 Price Channel
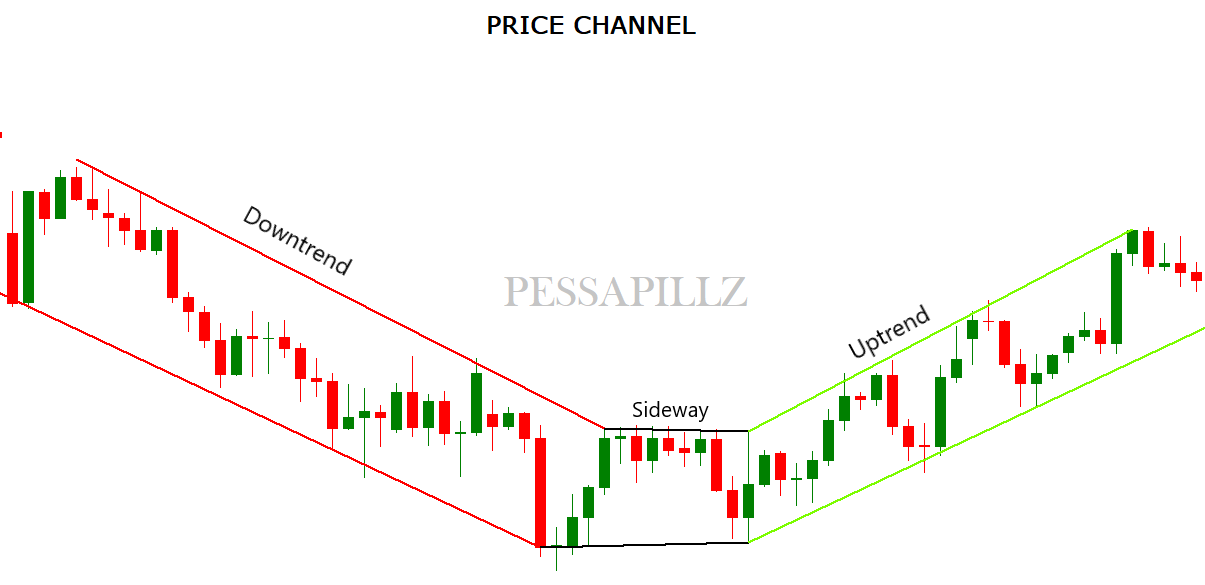
Is a continuation pattern that slopes up of down and is bound by an upper and lower trendline.
The upper trendline marks resistance and the lower trendline marks support
There are three types of channel;
 Triangle
Is the consolidation pattern that occur mid trend and usually signal a continuation of the existing trend.
There are three categories of Triangle
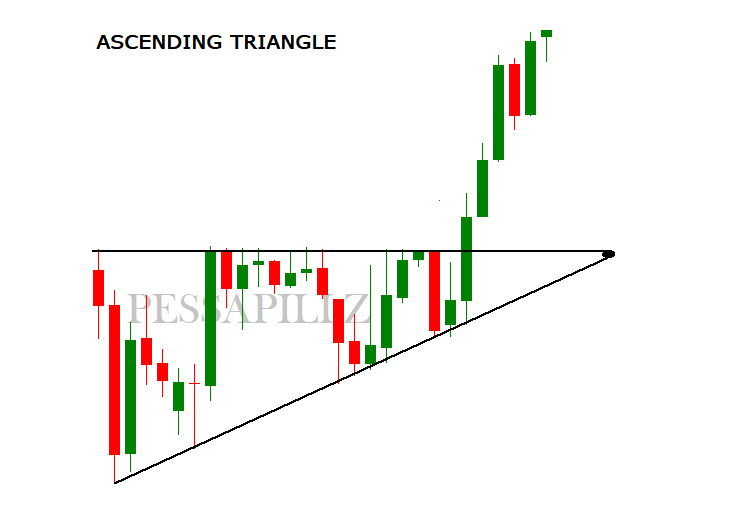
Ascending Triangle
Is the bullish continuation pattern which formed when the market makes higher lows and the same level highs.
This pattern is mostly formed in an uptrend to indicate continuation of the trend.
If this pattern formed in downtrend it can act as powerful reversal signal.
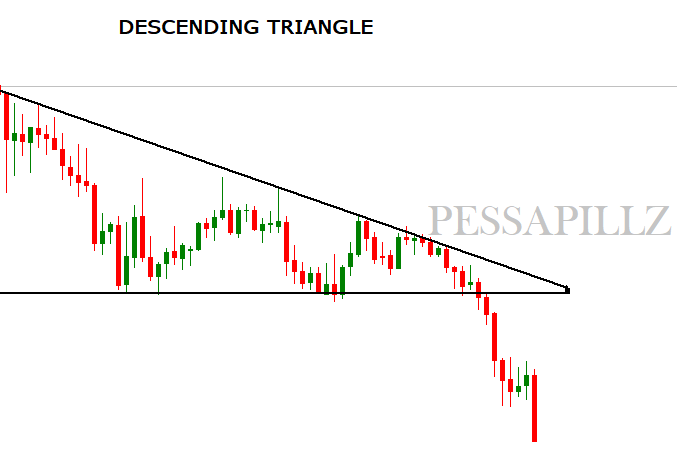
Descending Triangle
Is the bearish continuation pattern which formed when the market makes lower highs and the same level lows.
This pattern is mostly formed in an downtrend to indicate continuation of the trend.
If this pattern formed in uptrend it can act as powerful reversal signal.
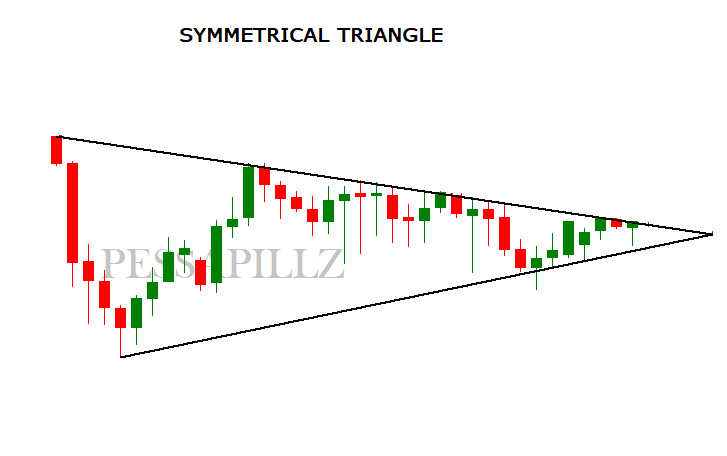
Symmetrical Triangle
This pattern represent a period of consolidation before the price is forced to breakout or breakdown. A breakdown from the lower trendline marks the start of new bearish trend.
A breakup from the upper trendline indicates the start of the new bullish trend.
The following below are some of chart pattern we going to discuss
- Head and Shoulders
- Double Top and Double Bottom
- Triple Top and Triple Bottom
- Price Channels
- Triangle
It is a trend reversal formation.
It's called head and shoulders because this is kind of what looks like.
Bearish Head and Shoulders
This is the signal that bullish trend it's over the market now reverse from bullish to bearish trend.
This is the signal that bearish trend is reached at the end now the market is reverse to bullish
A double top is a bearish reversal chart pattern.
A double botton is a bullish reversal chart pattern.
A bearish reversal pattern.
Triple BottomA triple bottom is a bullish reversal chart pattern.
Price ChannelIs a continuation pattern that slopes up of down and is bound by an upper and lower trendline.
The upper trendline marks resistance and the lower trendline marks support
There are three types of channel;
- Uptrend Channel
- Down Trend Channel
- Sideway Channel
TriangleIs the consolidation pattern that occur mid trend and usually signal a continuation of the existing trend.
There are three categories of Triangle
- Ascending Triangle
- Descending Triangle
- Symmetrical Triangle
Ascending Triangle
Is the bullish continuation pattern which formed when the market makes higher lows and the same level highs.
This pattern is mostly formed in an uptrend to indicate continuation of the trend.
If this pattern formed in downtrend it can act as powerful reversal signal.
Descending Triangle
Is the bearish continuation pattern which formed when the market makes lower highs and the same level lows.
This pattern is mostly formed in an downtrend to indicate continuation of the trend.
If this pattern formed in uptrend it can act as powerful reversal signal.
Symmetrical Triangle
This pattern represent a period of consolidation before the price is forced to breakout or breakdown. A breakdown from the lower trendline marks the start of new bearish trend.
A breakup from the upper trendline indicates the start of the new bullish trend.