CANDLESTICK AND MARKET TREND
Candlestick and Trend
You will learn step by step price action trading as you learned in basic course here you will learn about;
- Which candlestick you should pay attention to.
- How to distinguish weaker, stronger and sideway trend.
- High timeframe All these things mentioned above will help you to trade price action.
- Pinbar
- Quadrants - historical buyers/sellers.
- Strong Vs Weak trend
Pinbar
Lets focus on Pinbar or Pins structure.- Long upper or lower wick (tail/shadow).
- The end opposite wick is called the nose.
- The nose should be shorter than the main wick.
- The longer the wick the better.
- Body between tail and nose
 This candlestick can be called many names such as hammer,hanging man, doji, inverted hammer but actual the right name is pinbar.
Does not matter if had no nose still its a pinbar.
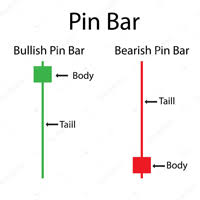
There are two type of pinbar
- Bullish Pinbar
- Bearish Pinbar
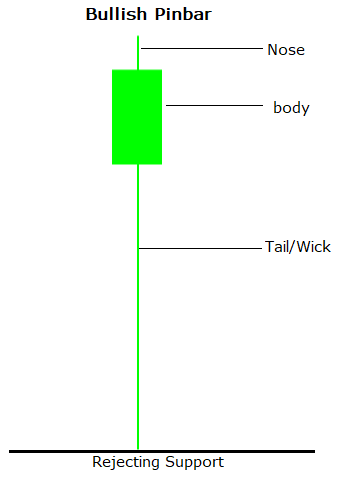
Bullish Pinbar
- Bullish pinbar's tail is pinning down.
- Rejecting the Support (Buying zone).
- Now moment buyers.
- Afterwards the price usually rises.
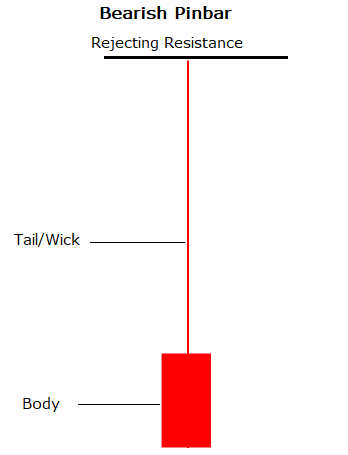
Bearish Pinbar
- Bearish pinbar's tail is pinning up.
- Rejecting the Resistance (Selling zone).
- Now moment Sellers.
- Afterwards the price usually drops.
PINBAR IS THE BEST INDICATOR FOR REVERSAL
This is point of confluence.
It is better to practice how to spot zones because it is important in price action trading.
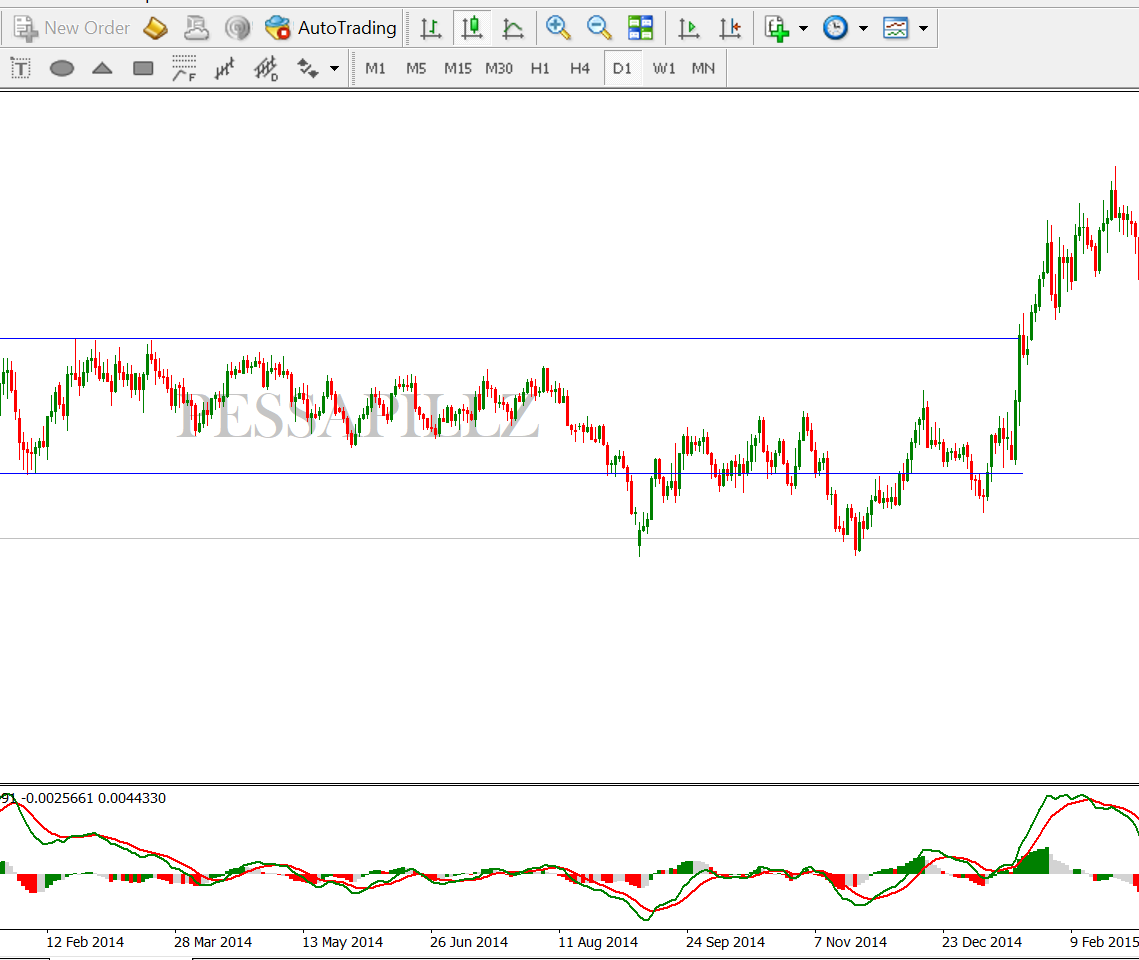
Below chart its shows the reaction of pins on the zone.
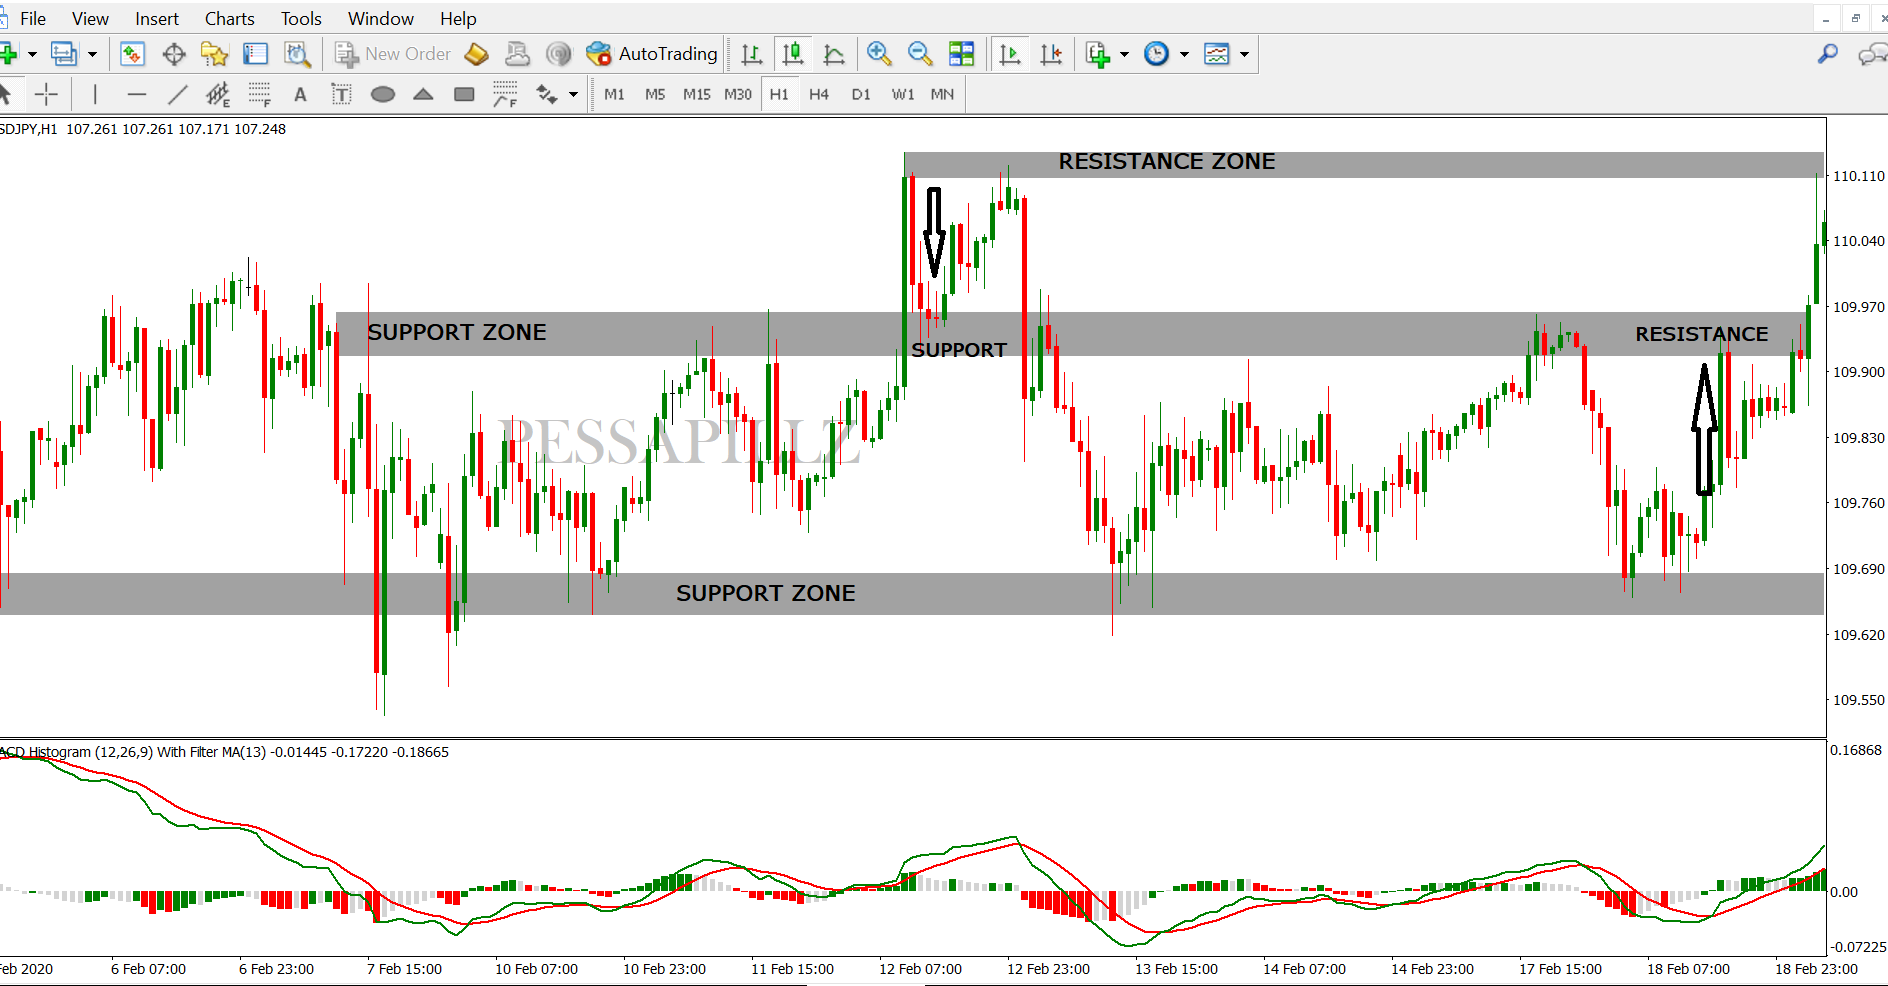 Other candlestick pattern are non-impact to the zone but you can watch and spot now moment.
Quadrants - Historical buyers/sellers
Defining buyers and sellers via candlesticksHistory in FOREX market always repeat.
Open higher Timeframes (4H+). Focus on WICKS.
Those are historical buyers/sellers.
This is important concept.
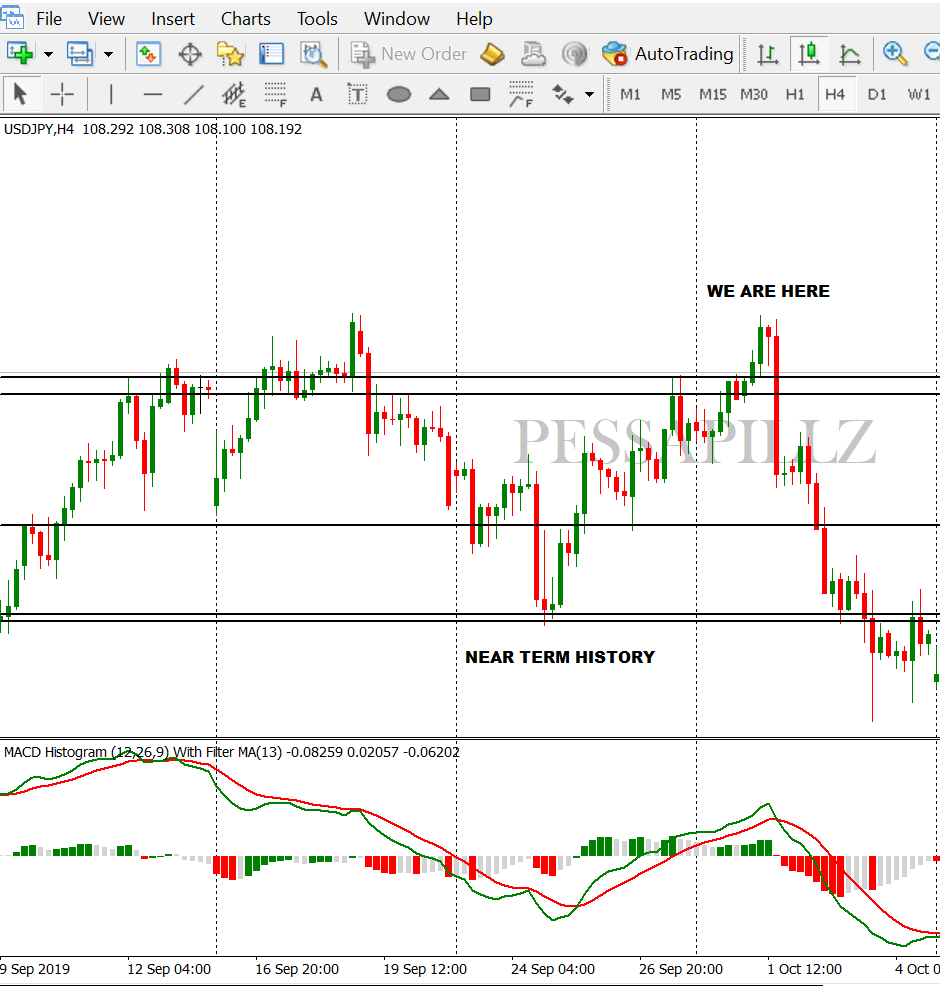
How to put quadrants in the chart?
- Open H4 timeframe.
- PRESS
CTRL+Y - You will see vertical lines.
- Space between the lines is called QUADRANT.
- Each quadrant is 7 days worth of Price Action.
- Mark most obvious wicks or pinbars using the FIRST PREVIOUS QUADRANT.
- It near time Price History used to intraday trading/ Swings.
- Price will react at these manualy drawn levels .
- We mark those lines at the beginning of each week for previous week.
This is point of confluence.
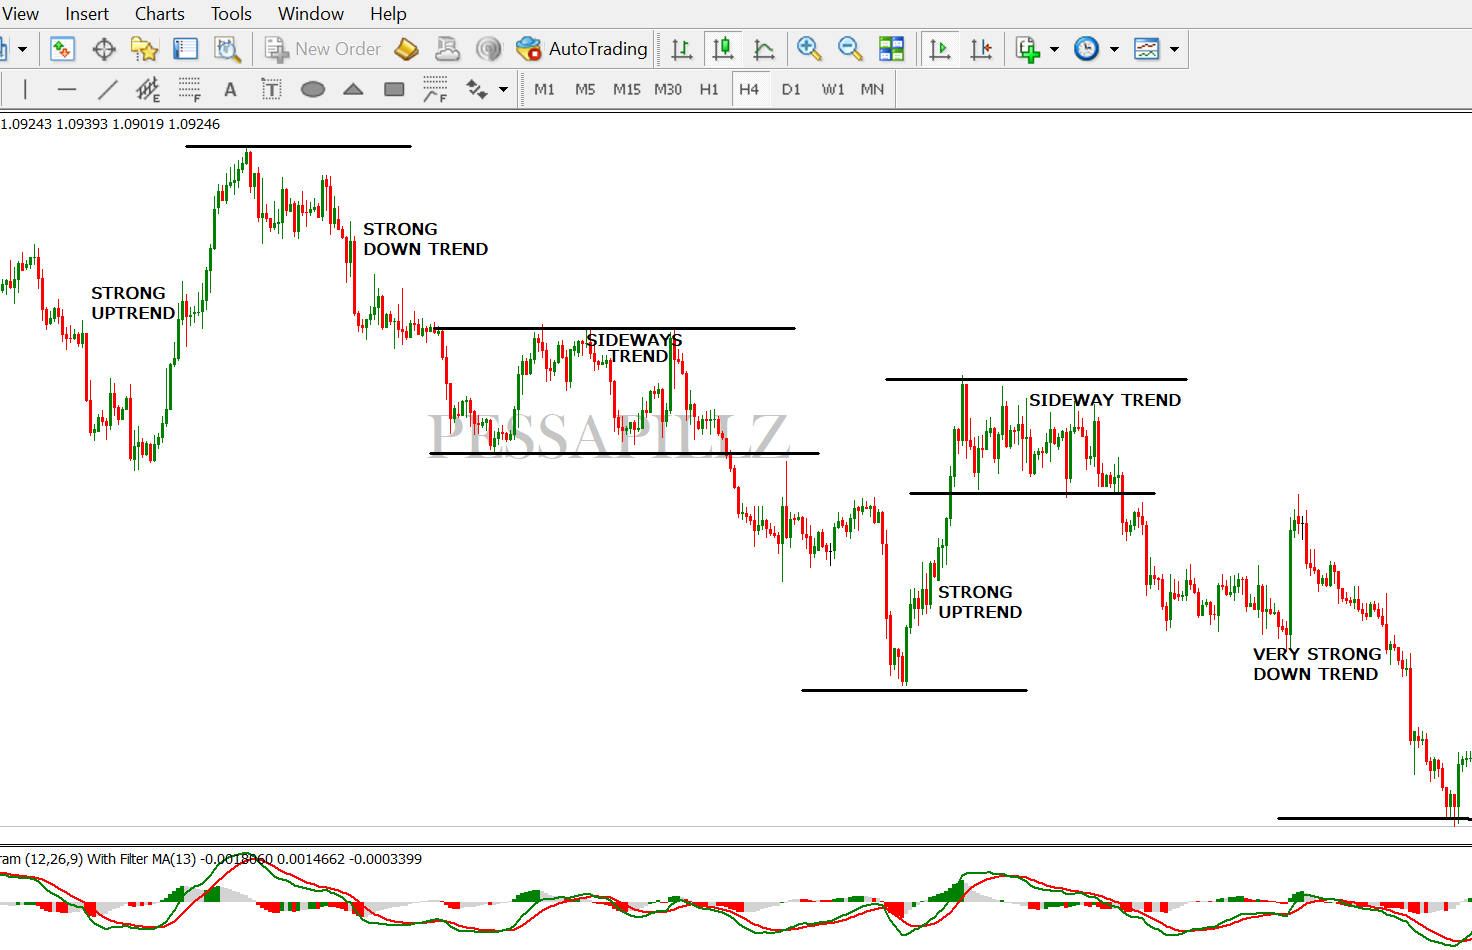
Trend Concepts
Trend is a series of price movements which determines the MAIN direction.- UPTREND is a series of Higher Highs and Higher Lows.
- DOWN TREND is a series of Lower Highs and Lower Lows.
- Trend exists on each timeframe.
- The higher the timeframe the stronger the trend is.
Strong VS Weak trend
Easily defined by looking at Higher Timeframes.
Using 4H momentum in lower timeframe is called sclapping.
 TREND IS YOUR FRIEND.
The trend is created by market movers.
Trend is buy lower - sell higher while the price follows trend pattern.
Remember: Trend exists on each timeframe.
Smart Money are sharks, you are the fish so you must follow them.
Home Work
- You need to find pinbar and spot the trend on any timeframe.
- Practice Quadrants and historical buyers/sellers.
Trendlines and Channels
Contents
- Trendlines
- Type of Trendlines
- Channels
- Simply is the visual representation of support and resistance in any given timeframe, we are not seen but we draw them. By definition:
- Is a line that drawn over swing highs in downtrend or under swing lows in uptrend to show the prevailing direction of price.
Characteristics of Trendline
- Trendline must have atleast 2 touches to become valid.
- 3 touches are strong.
- The more touches the trendline has the more powerful the move after a trendline break.
- Long trendlines more important than shorter one.
- Shallow trendline are more reliable than steep trendlines.
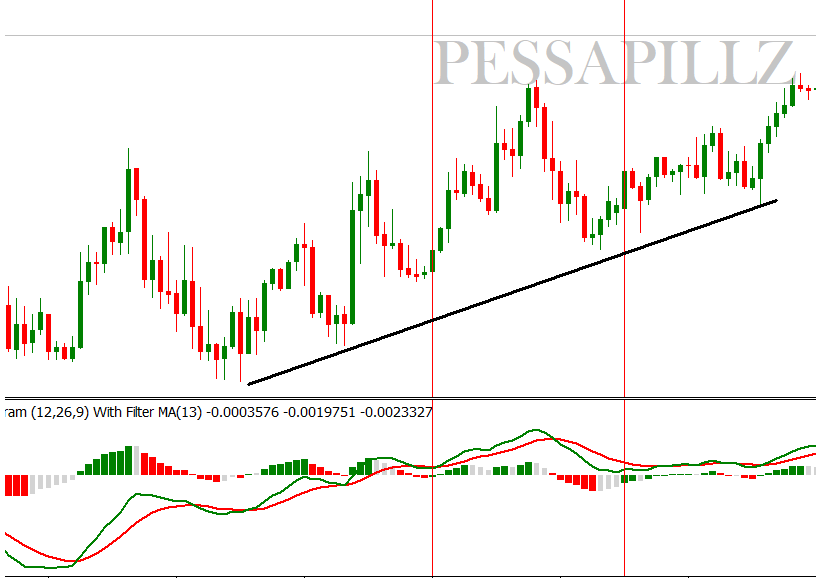
Way to draw trendline
- Connect Wicks.
- Bodies can be connected too but its rarely, wicks indicate buyers and sellers.
- Connect bottom with ascending line - Uptrend.
- Connect tops with descending line - Downtrend.
What kind of trendlines we use in trading?
- Inner Trendlines.
- Intra - day Trendlines.
- Intra - week Trendlines.
- Intra - month trendlines (usually intra-week trendline).
Inner Trendline
- Trendline which has already been broken.
- Its good confluence point for support / Resistance.
- Price tends to retest it.
- It is always WITHIN the price candles.
- Inner trendline is not Timeframe dependent.
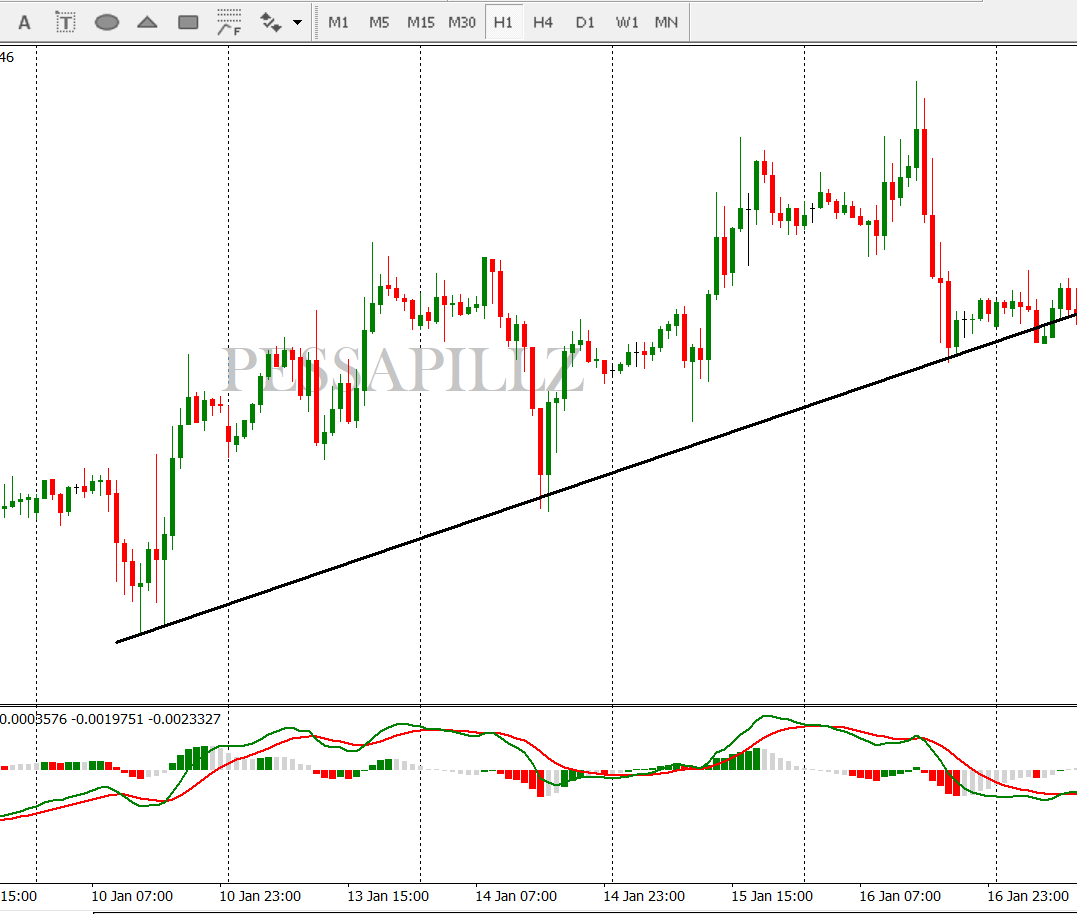
Intraday Trendline
- Trendline shows up to 3 days of price action.
- Plotted on M15 - H1 .
- Marks important support/resistance levels.
- It is Timeframe dependent.
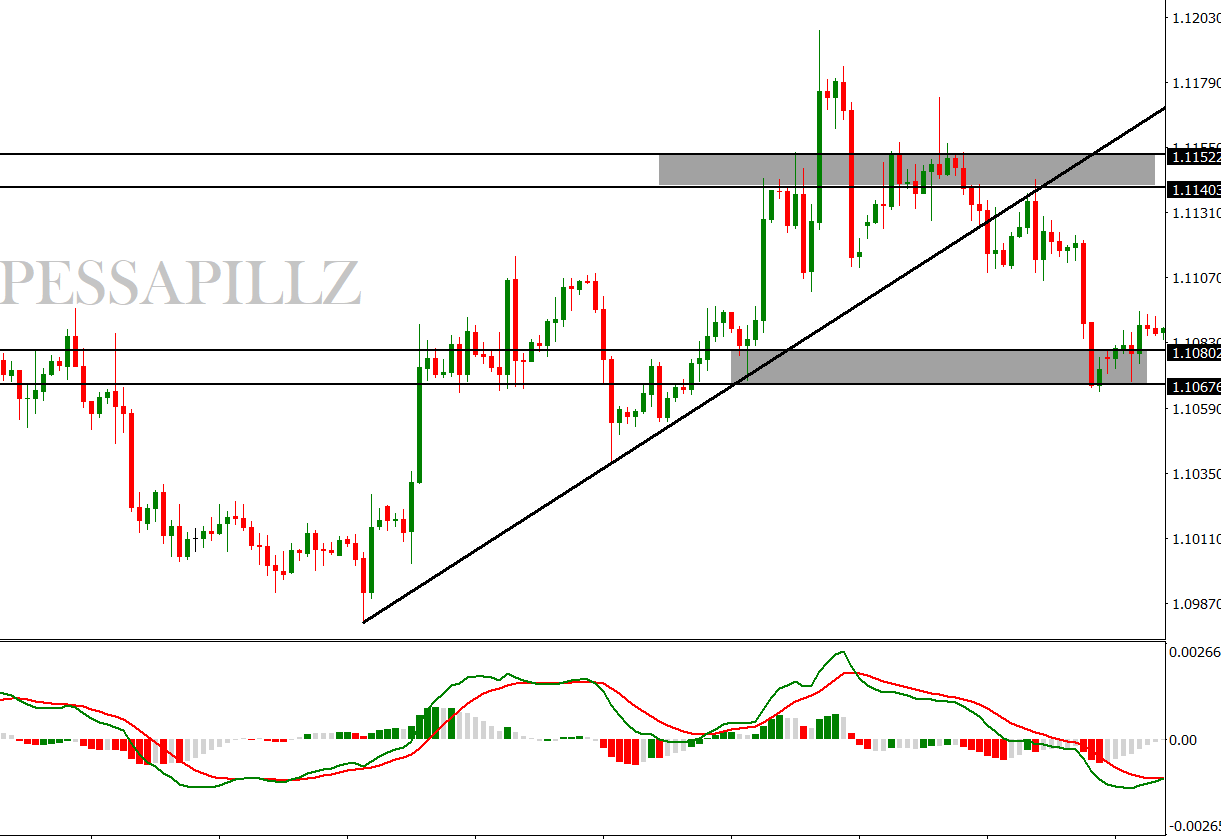
Intra-Week Trendline
- Intra - Week trendline is support the trend during the week - time price action.
- 7 - 28 days long.
- Strong support/resistance.
- Easy to draw it on intraday Timeframe.
- Aligning higher Timeframe trend with lower Timeframe retracement.
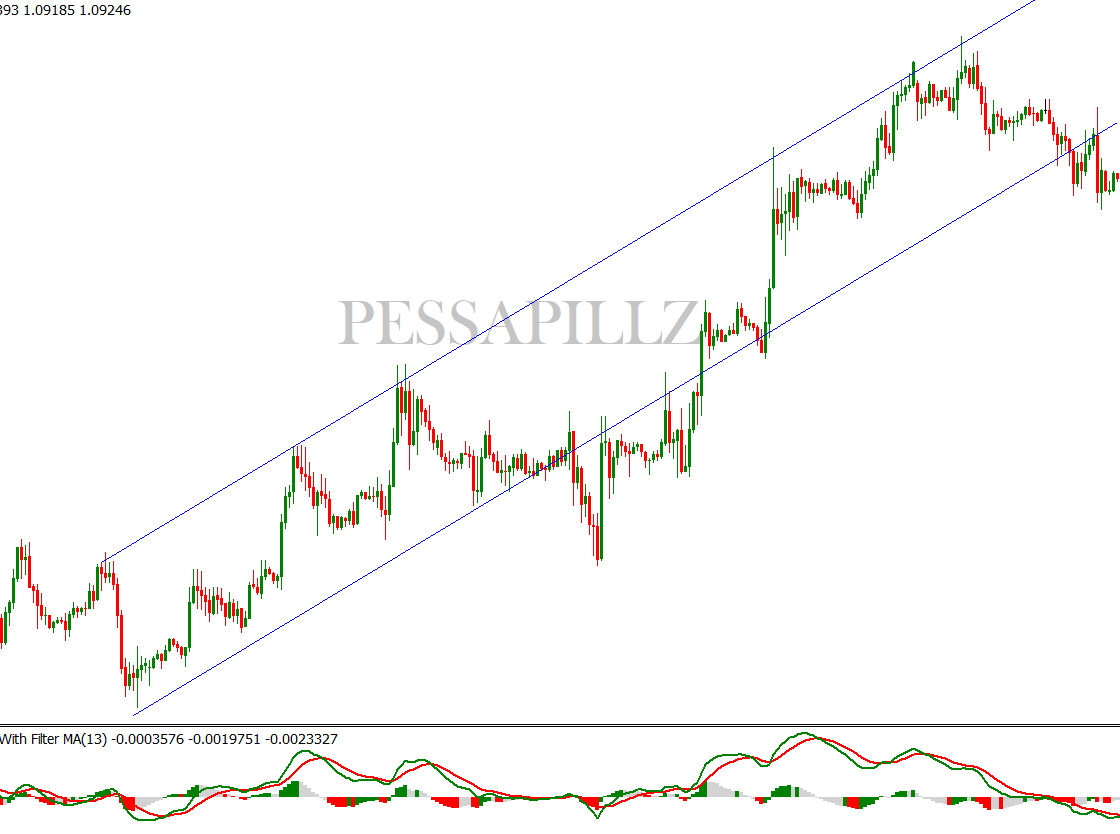
Channel
Channels represents the tops and bottom in the price of a particular. These are areas of support and resistance.
To create an Up (ascending) channel draw a parallel line at the same angle as an uptrend line and then move that line to position where it touches the most recent peak.
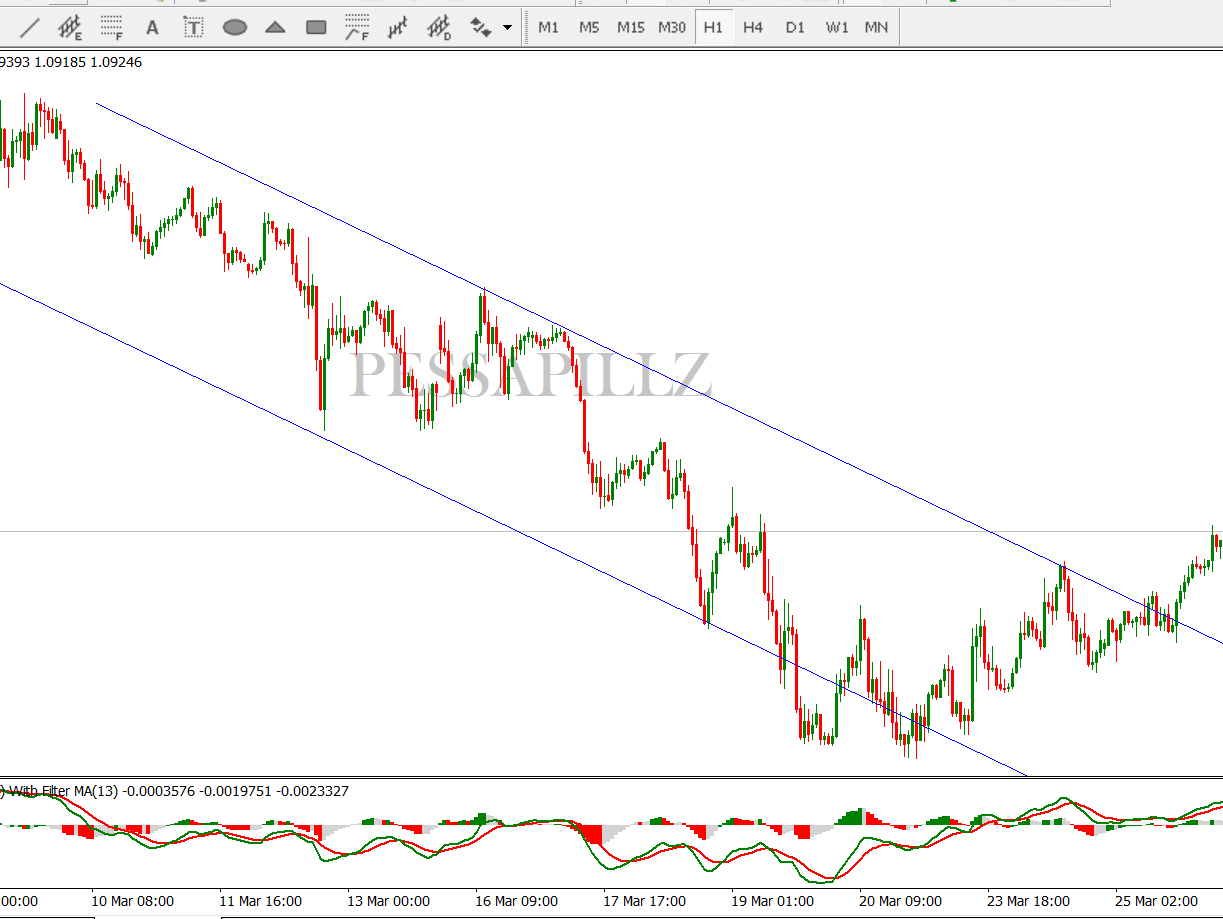
To create a Down (descending) channel draw a parallel line at the same angle as the downtrend line and then move that line to position where it touches the most recent bottom.
Types of channels
- Ascending channel
- Descending channel
- Horizontal channel
- Equidistant channel
- Moving Average channel
- 1. Ascending channel
- 2. Descending channel
- 3.Horizontal channel