FOREX CHARTS
Forex Chart
The forex chart is simply a graphical depiction of the exchange rate between two currencies.
This shows how the exchange rate of the currency has changed overtime.
There three types of chart
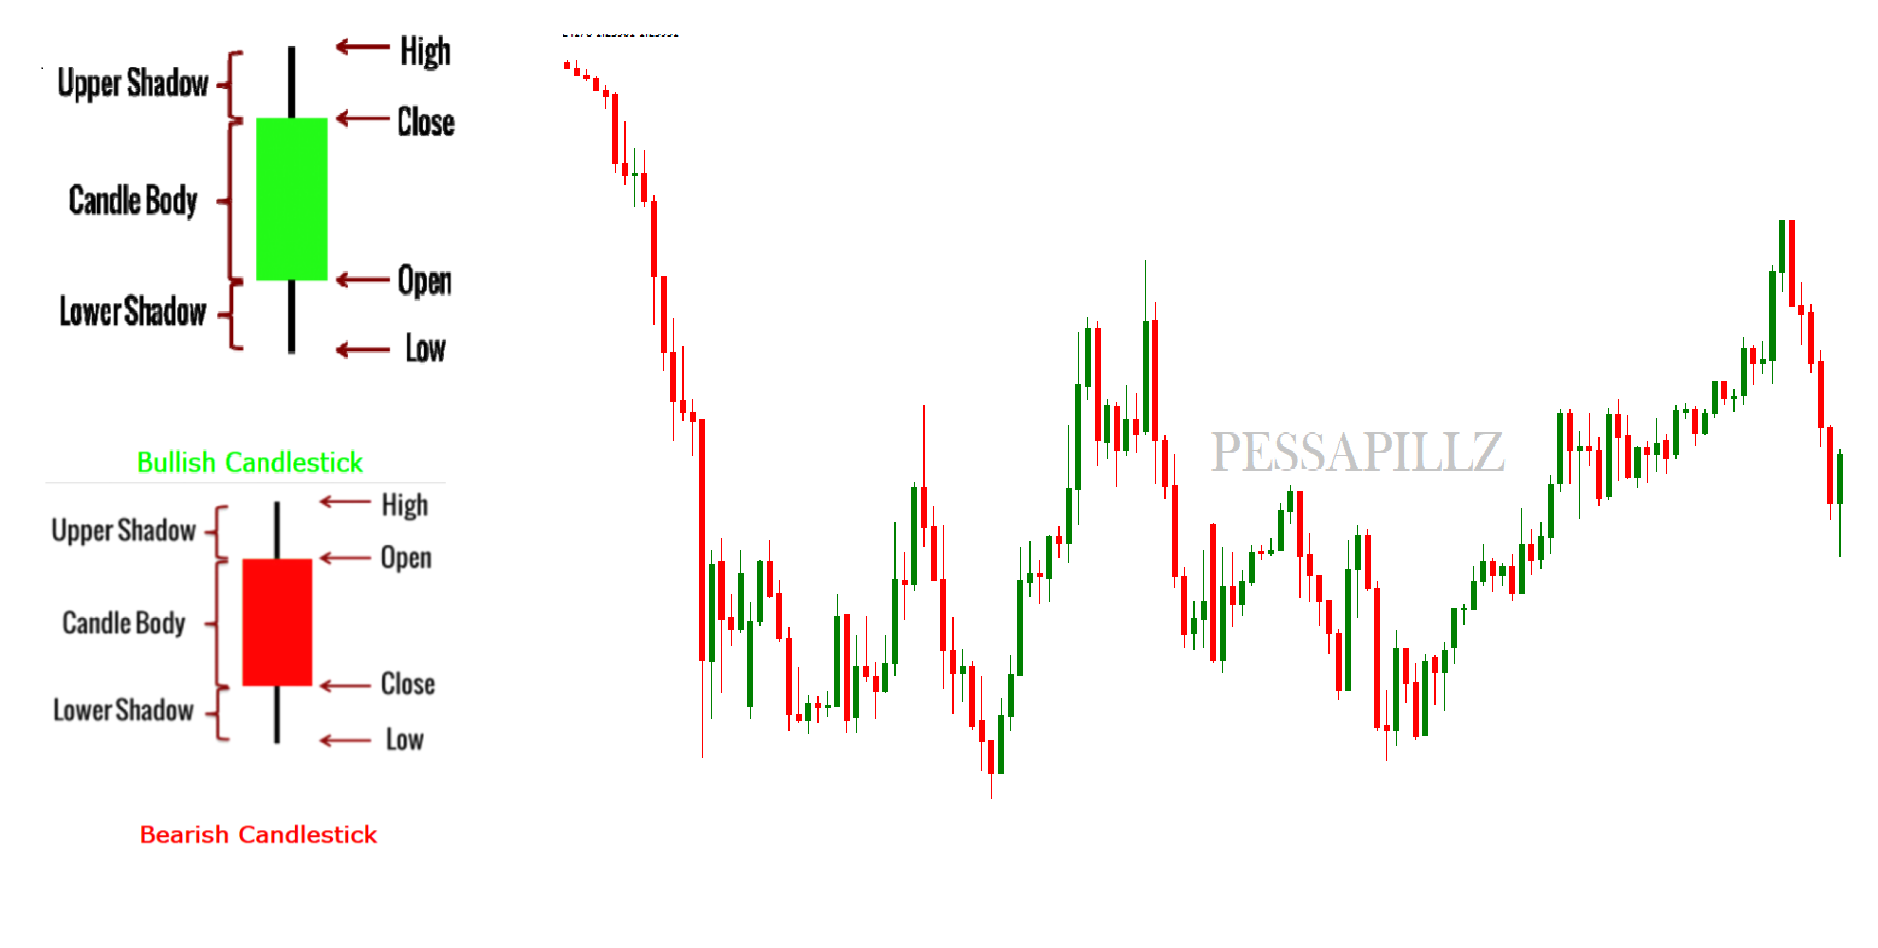
2. Candlestick Chart: This shows opening price, while simultaneously showing the closing price, as well as the highs and lows.
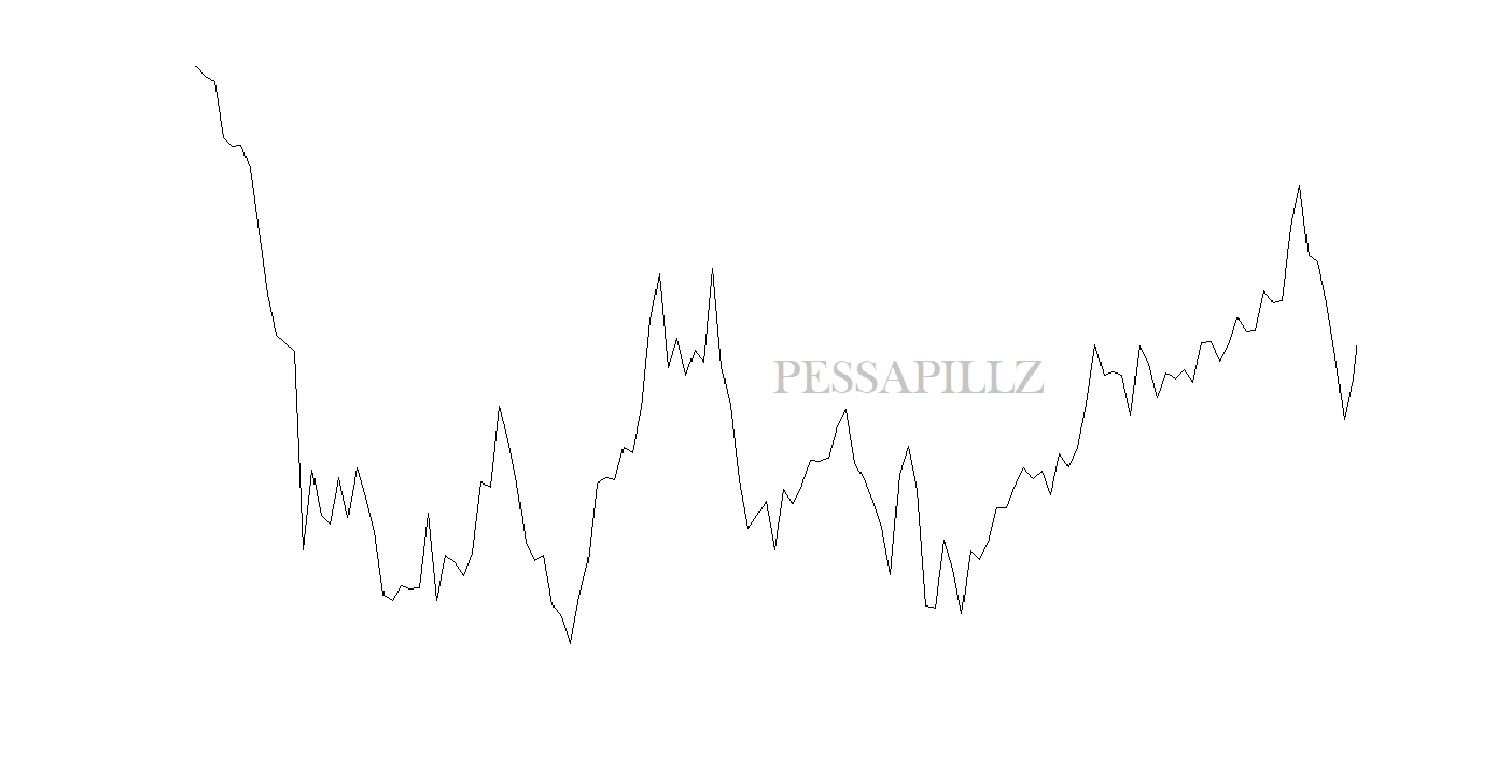
3. Line Chart: Is simple chart draws a line from one closing price to the next closing price
The forex chart is simply a graphical depiction of the exchange rate between two currencies.
This shows how the exchange rate of the currency has changed overtime.
There three types of chart
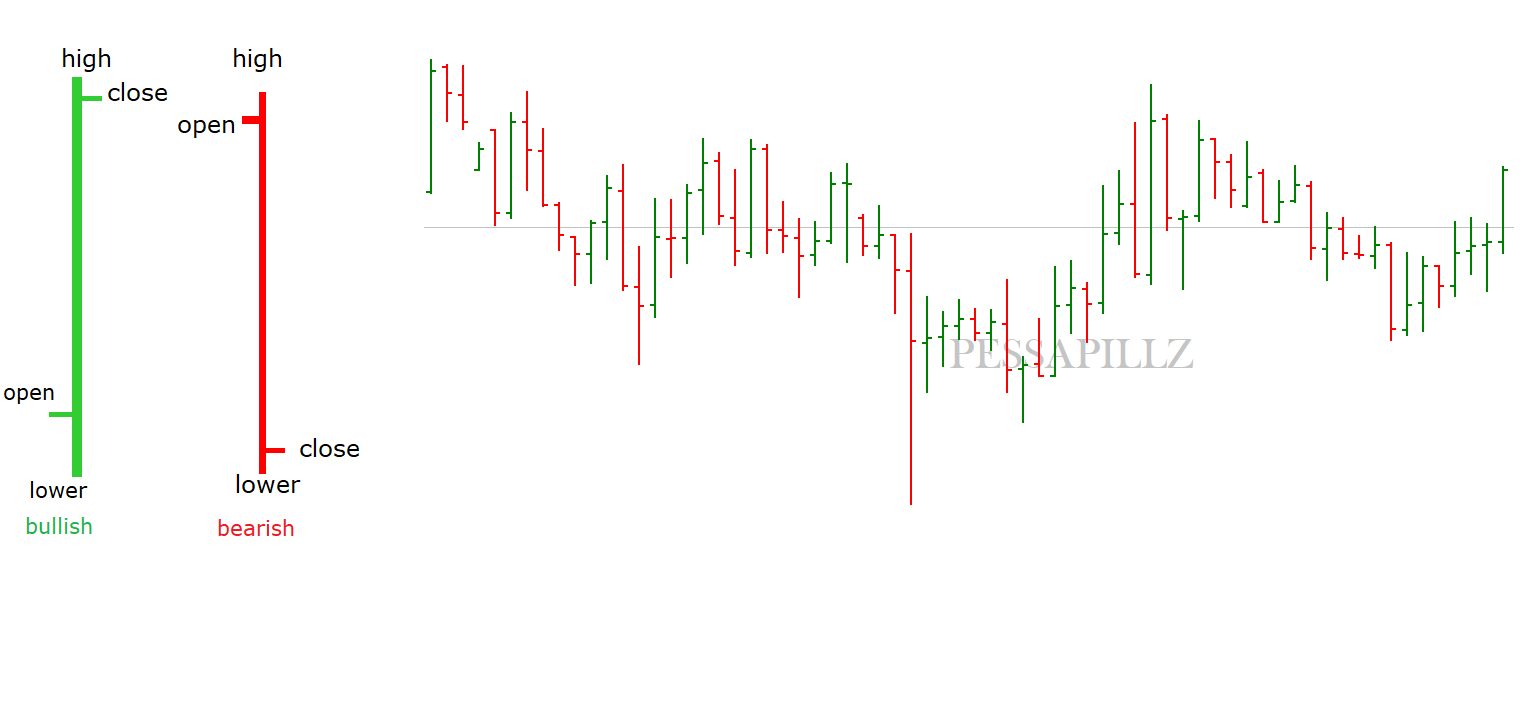
- Bar Chart
- Candlestick Chart
- Line Chart
2. Candlestick Chart: This shows opening price, while simultaneously showing the closing price, as well as the highs and lows.
3. Line Chart: Is simple chart draws a line from one closing price to the next closing price